Congressional Midterms Through History
Congressional Midterms Through History

While the biennial election of all 435 members of the House and one-third of the Senate typically lacks the voter interest and political firepower of a presidential election every four years, the midterms often have a profound impact on the makeup and direction of Congress. The mandate to hold the elections stems from just a few words in the U.S. Constitution:
"The House of Representatives shall be composed of Members chosen every second Year by the People of the several States." — Article 1, Section 1.
Here's what you need to know about the history of midterms:
Presidential role
Midterm congressional elections are often seen as a referendum on the incumbent president. Many presidents have seen their popularity decline during their first two years in office, and that often leads to a weaker turnout of the president's supporters in a midterm. The opposition party tends to be more energized in a midterm, and historically that has led to the president's party losing seats. Since the U.S. Civil War in the 1860s, the president's party has lost ground in 36 of the 39 midterm elections.
By the numbers
Average losses for a president's party since World War II: 26 House seats and three to four Senate seats.
Average House losses when a president's approval rating is above 50 percent: 14 seats.
Average House losses when a president's approval rating is below 50 percent since 1970: 33 seats.
Worst midterm results since World War II: Democrats lost 63 House seats under President Barack Obama in 2010 and 52 House seats under President Bill Clinton in 1994. Republicans lost 30 House seats under President George W. Bush in 2006 and 48 House seats under President Gerald Ford in 1974.
Defying history
Democrats gained five House seats in 1998 following the Republican-led impeachment of Clinton. Republicans gained eight House seats and two Senate seats under George W. Bush in 2002, the first election since the terrorist attacks of September 11, 2001.
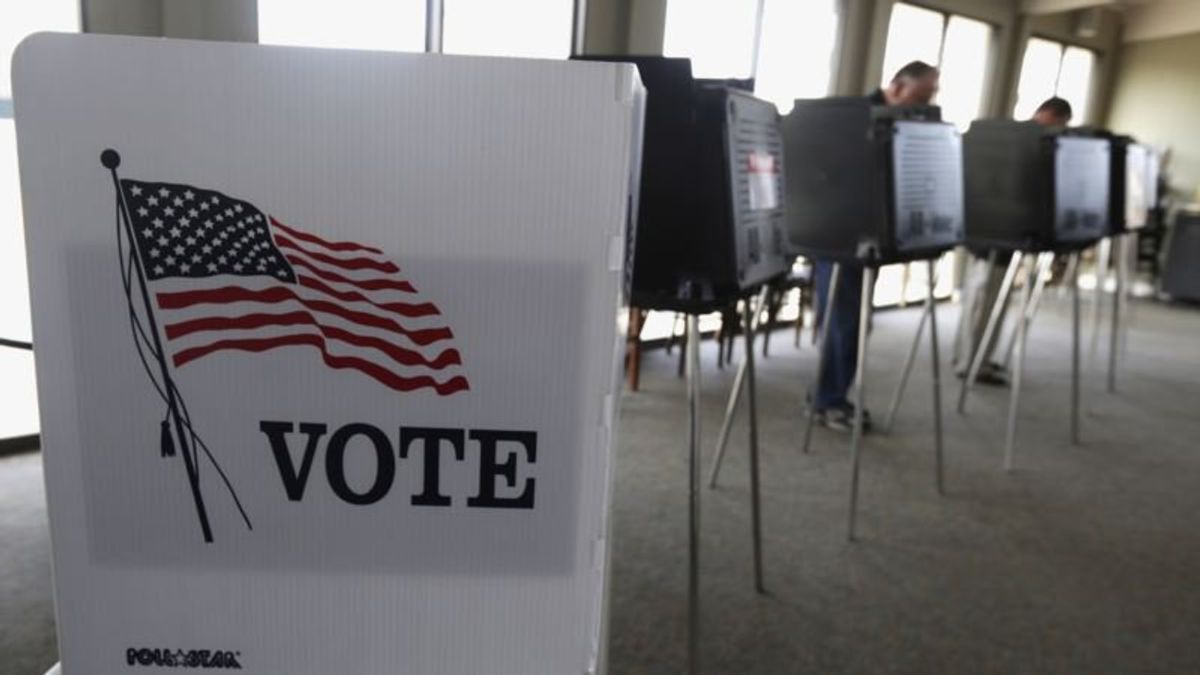
Voter turnout
During presidential election years, turnout averages between 50 percent and 60 percent of eligible voters. That figure drops to about 40 percent during congressional midterm elections.
2014 midterm voter turnout: 36.4 percent, lowest figure since 1942.
2016 presidential voter turnout: 58.1 percent.
Sources: The American Presidency Project, Gallup Polling, Center for Politics at the University of Virginia.
Tags
US Politics North Dakota Voters Have Outsized Say in Supreme Court BattleNext PostFormer Arizona Senator Kyl to Replace McCain
Related Posts


Steve Gruber & The Freedom Project - One Nation (Official Music Video)
DOWNLOAD NOW->