ON THE GROUND IN CHICAGO: EXPOSING ACTIVISTS AIDING ILLEGALS | LAW AND BORDER WITH BEN BERGQUAM
MOMS FOR LIBERTY - SEA TO SHINING SEA - CELEBRATING AMERICA 250
Join LIVE Saturday night at 7PM ET.
WATCH THE AMERICA FIRST RODEO - FREEDOM 250
OFFICIAL TRUTH BOMB VIDEO JUST OUT!
Real America’s Music Presents: “Truth Bomb”, by The Truth Bombers—an explosive anthem calling out media manipulation, narrative control, and the power of unapologetic truth. DOWNLOAD it now and let’s make some noise by driving it to #1 in the charts! Thank you for your patriotism and help!
WATCH SECURING AMERICA WITH FRANK GAFFNEY M-F AT 5AM ET.
>
WATCH DAYBREAK WITH STEVE & IVEY GRUBER M-F FROM 6-8AM ET.
WATCH THE AMERICAN SUNRISE SHOW M-F AT 7AM ET.
WATCH THE LATEST EDITION OF WAR ROOM WITH STEVE BANNON
WATCH THE CHARLIE KIRK SHOW M-F AT 12NOON ET.
HUMAN EVENTS DAILYWITH JACK POSOBIEC
CATCH THE LATEST AMERICA'S VOICE LIVE SHOW
JOIN THE ERIC BOLLING SHOW M-F AT 4PM ET.
WATCH JUST THE NEWS - NO NOISE
THE GRANT STINCHFIELD TONIGHT SHOW M-F AT 7PM ET.
WATCH LIVE FROM STUDIO 6B M-F AT 8PM ET.
TURNING POINT TONIGHT SHOW M-TH AT 10PM ET.
CATCH THE AFTER HOURS SHOW WITH ALEX STEIN M-F AT 11PM ET.
WATCH THIS WEEK'S BREAKING POINT WITH DAVID ZERE
CATCH THE ROYCE WHITE SHOW EVERY SATURDAY MORNING AT 9AM ET.
ON THE INSIDE WITH JAMES O'KEEFE SATURDAYS AT 12 NOON ET.
WATCH AMERICA'S TOP 10 COUNTDOWN SATURDAYS AT 1PM ET.
JOIN THE TED NUGENT SPIRIT CAMPFIRE SHOW SATURDAYS AT 3PM ET.
WATCH THE CASE FOR AMERICA EVERY SATURDAY AT 4PM ET.
WATCH AMERICA SHINES WITH AUBREY SHINES SUNDAYS AT 6AM ET.
WATCH GET REAL WITH DAVID DESROSIERS - TUNE IN SUNDAYS AT 3PM ET.
WATCH THE CASE FOR AMERICA WITH TRENISS EVANS - SATURDAYS AT 4PM ET.
LAST CALL WITH MIKE CRISPI - SATURDAYS AT 8PM ET.
WATCH THE LATEST COWBOY LOGIC BARN PARTY
WATCH THE SHEMANE NUGENT FAITH & FREEDOM SHOW SUNDAYS AT 2PM ET.
MEDIA EXPOSED WITH ADAM WEISS SUNDAYS AT 6PM ET.
CATCH THE LATEST EPISODE OF LAW & BORDER WITH BEN BERGQUAM
CHECK OUT THE RIGHT NEWS SHOW WITH JAVIER NEGRE SUNDAYS AT 8PM ET.
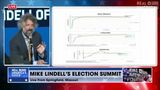
 Professor David K. Clements Explains Election Night ReportingNext videoProfessor David K. Clements Talks About Inexplicable Vote Ratios